Following on our theme of "what are people booking now" we are looking at booking variances across a few different dimensions for the period from boxing day to now vs 2019 (as I think you will all agree 2020 was just little bit unusual)
All 3 graphs are showing variance this year vs 2019.
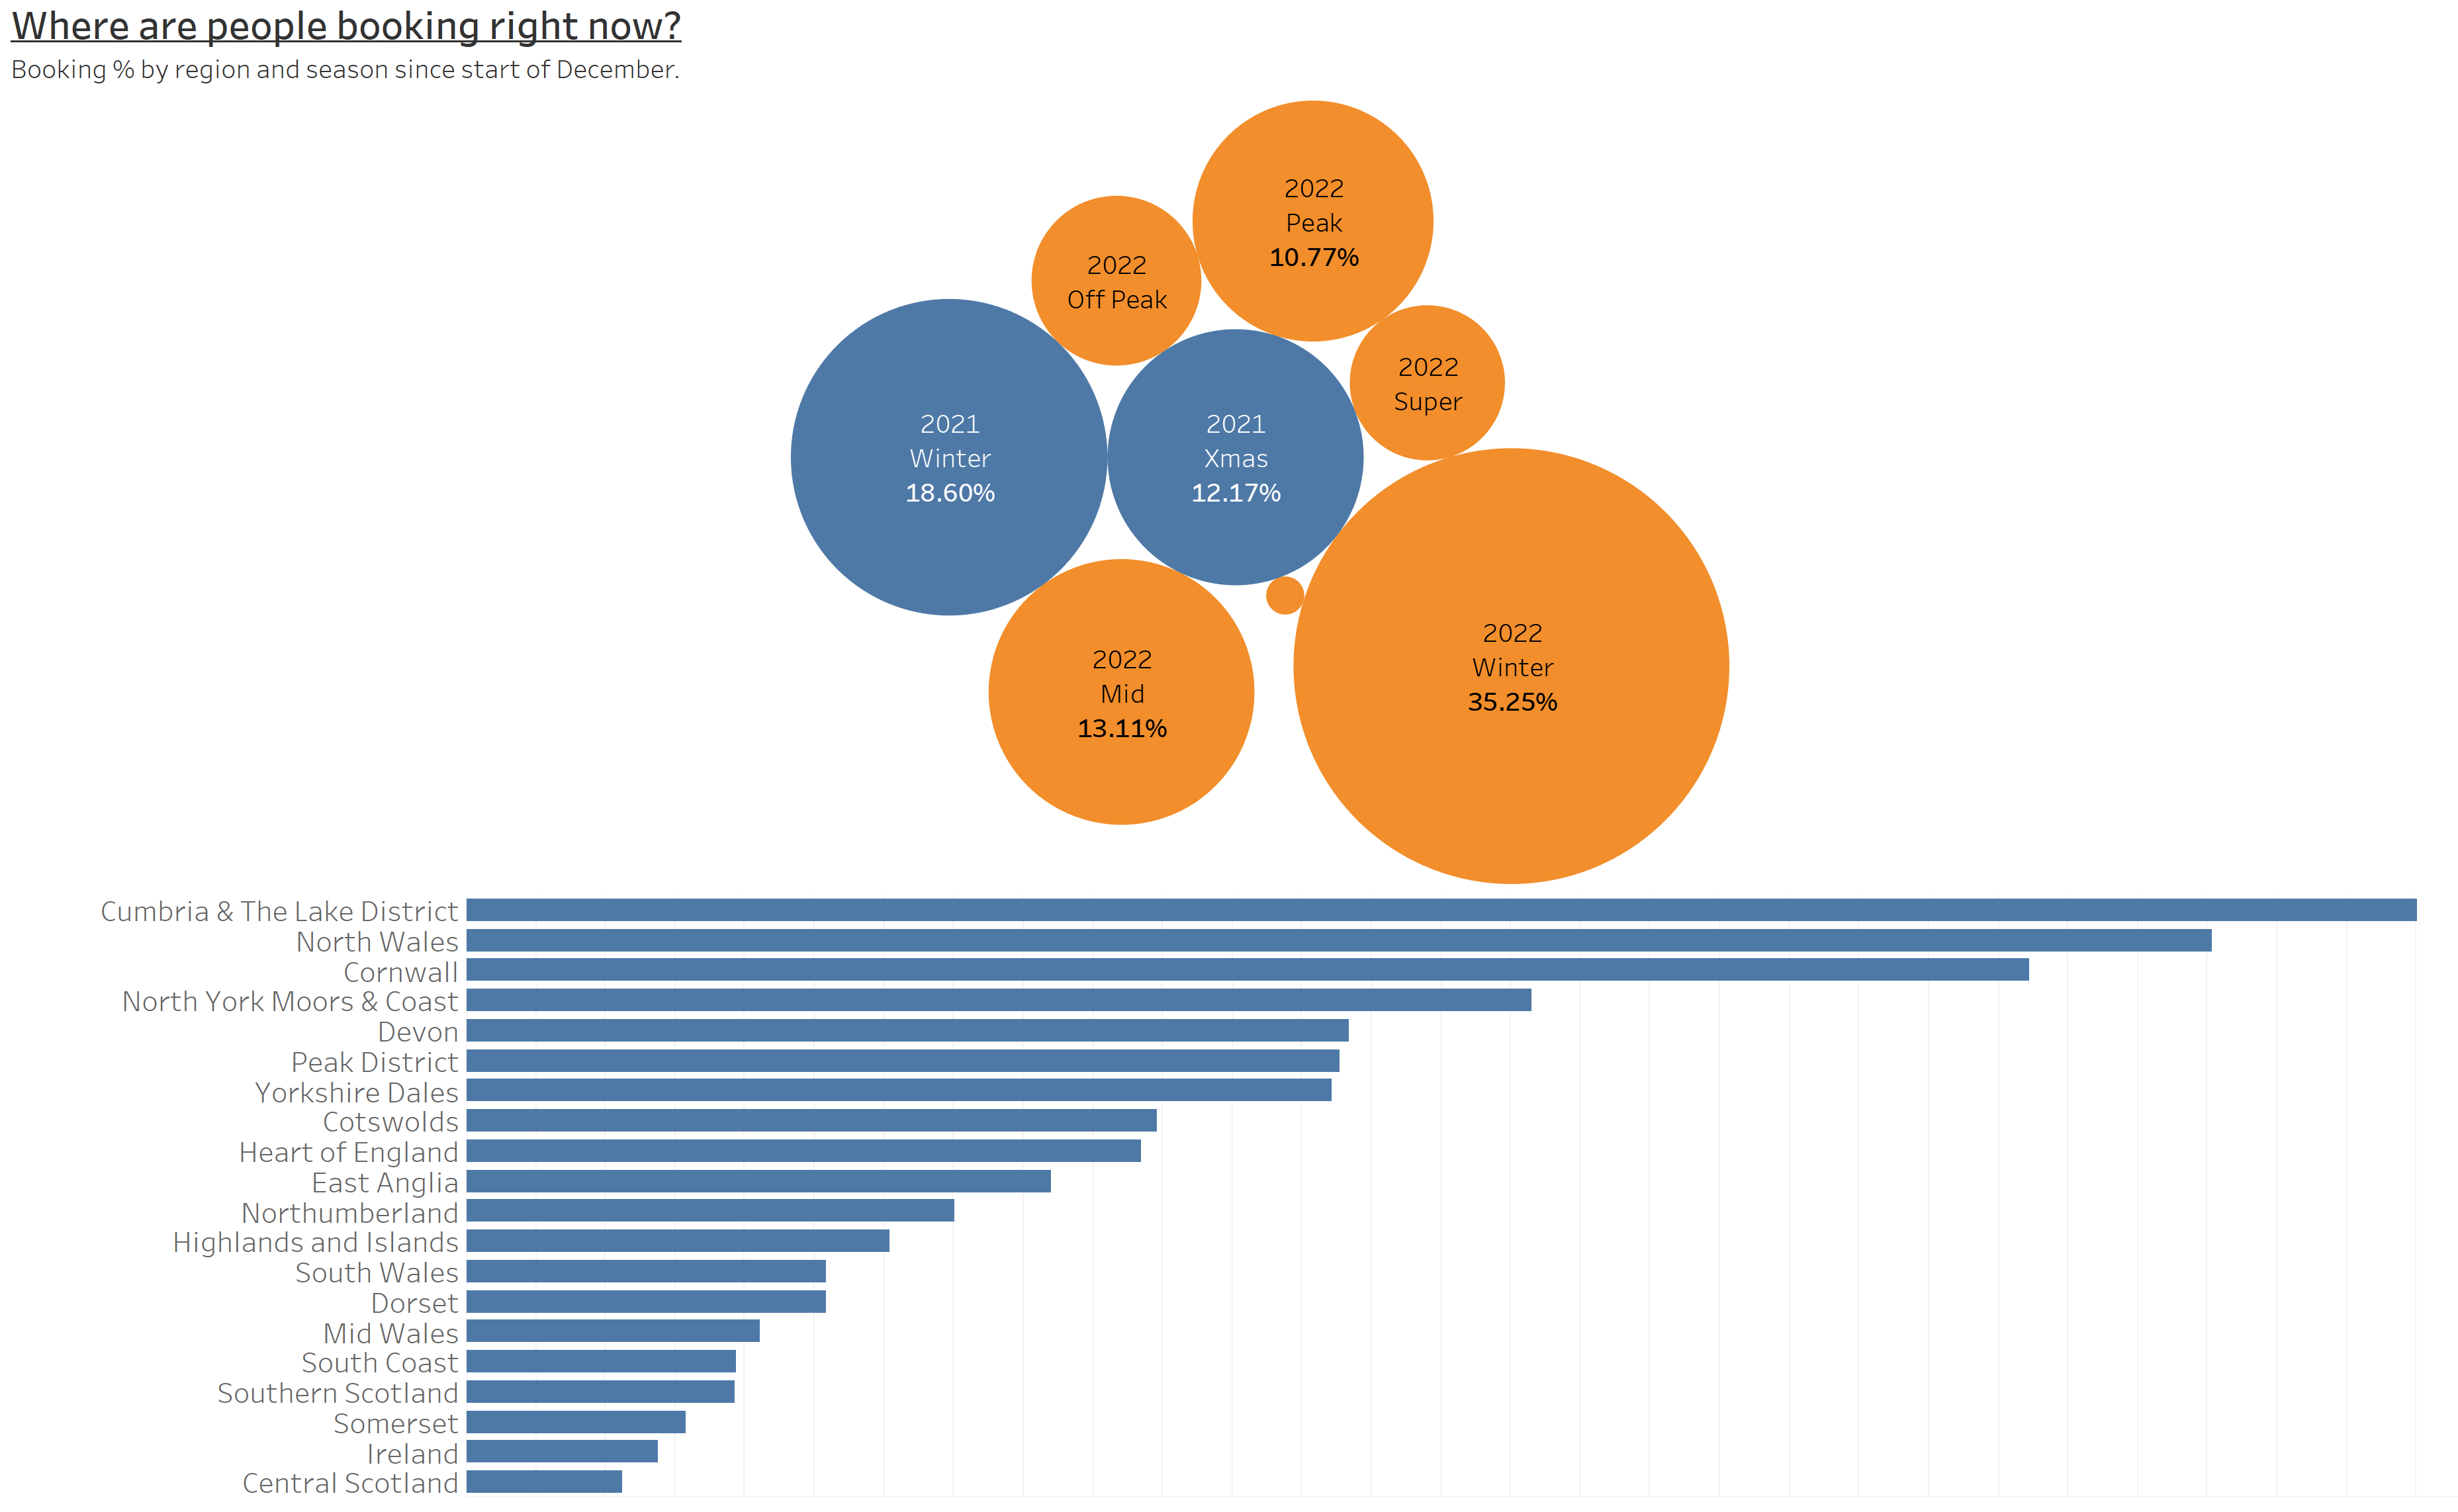
Booking Variance by Season
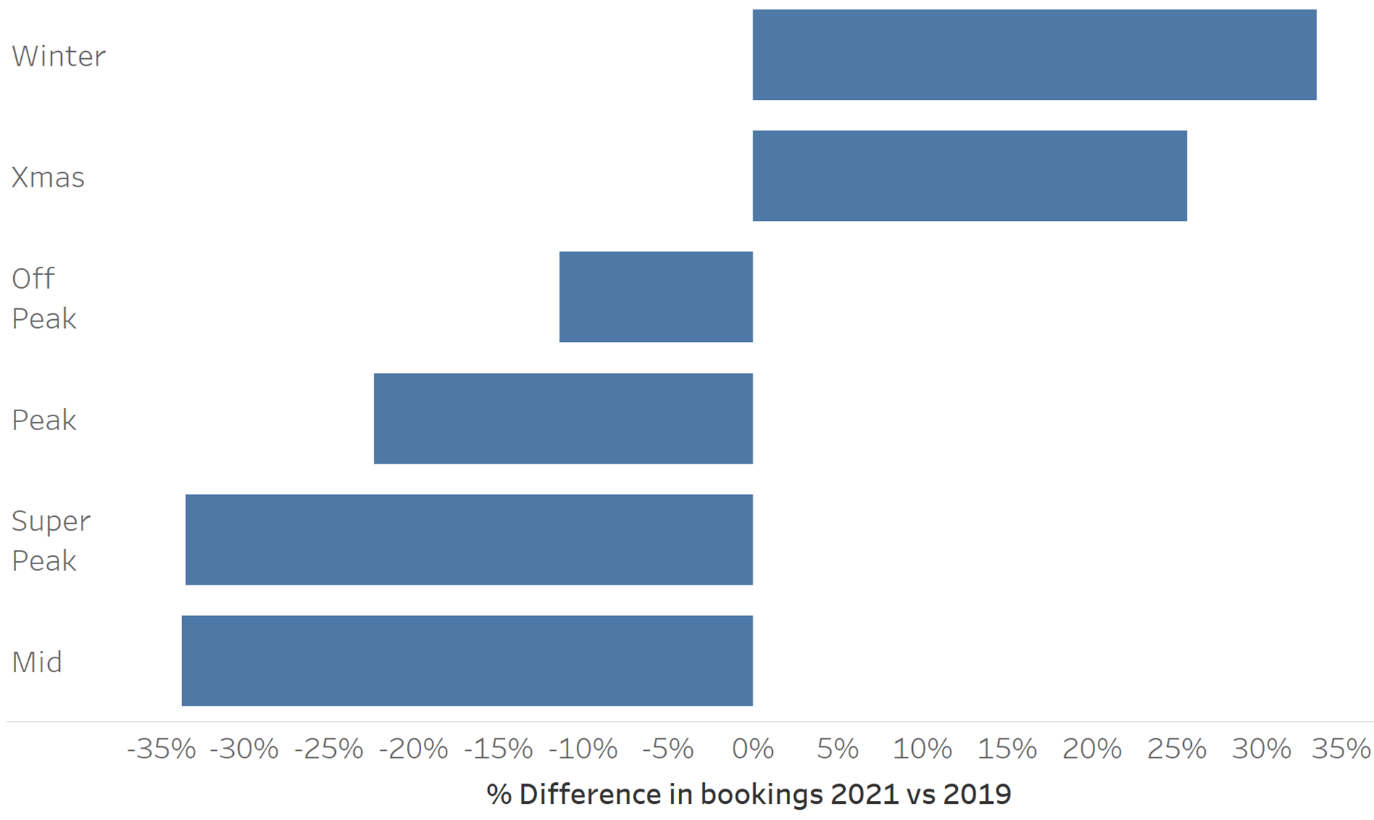
Firstly, looking at season there is a clear shift, to more Winter and Xmas (period) bookings.
Explained in part by the next chart which breaks down this variance into weeks until departure (lead time).
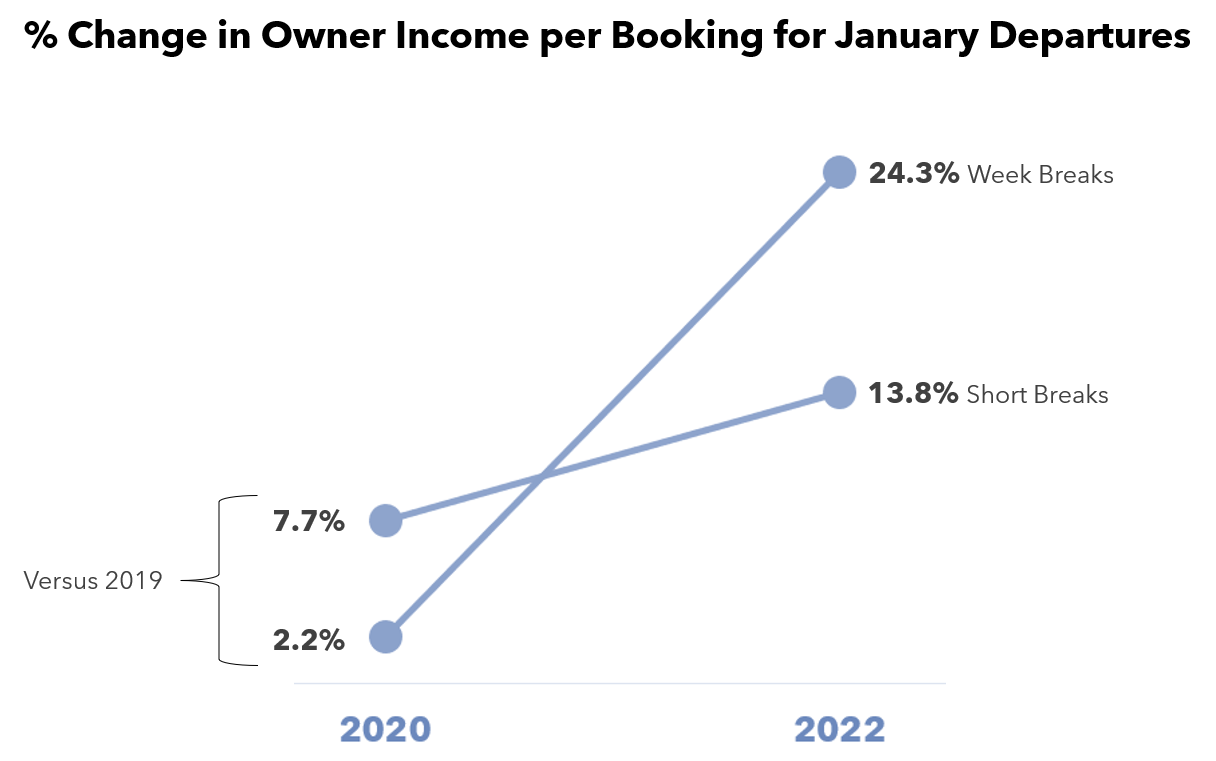
Variance by number of weeks to departure
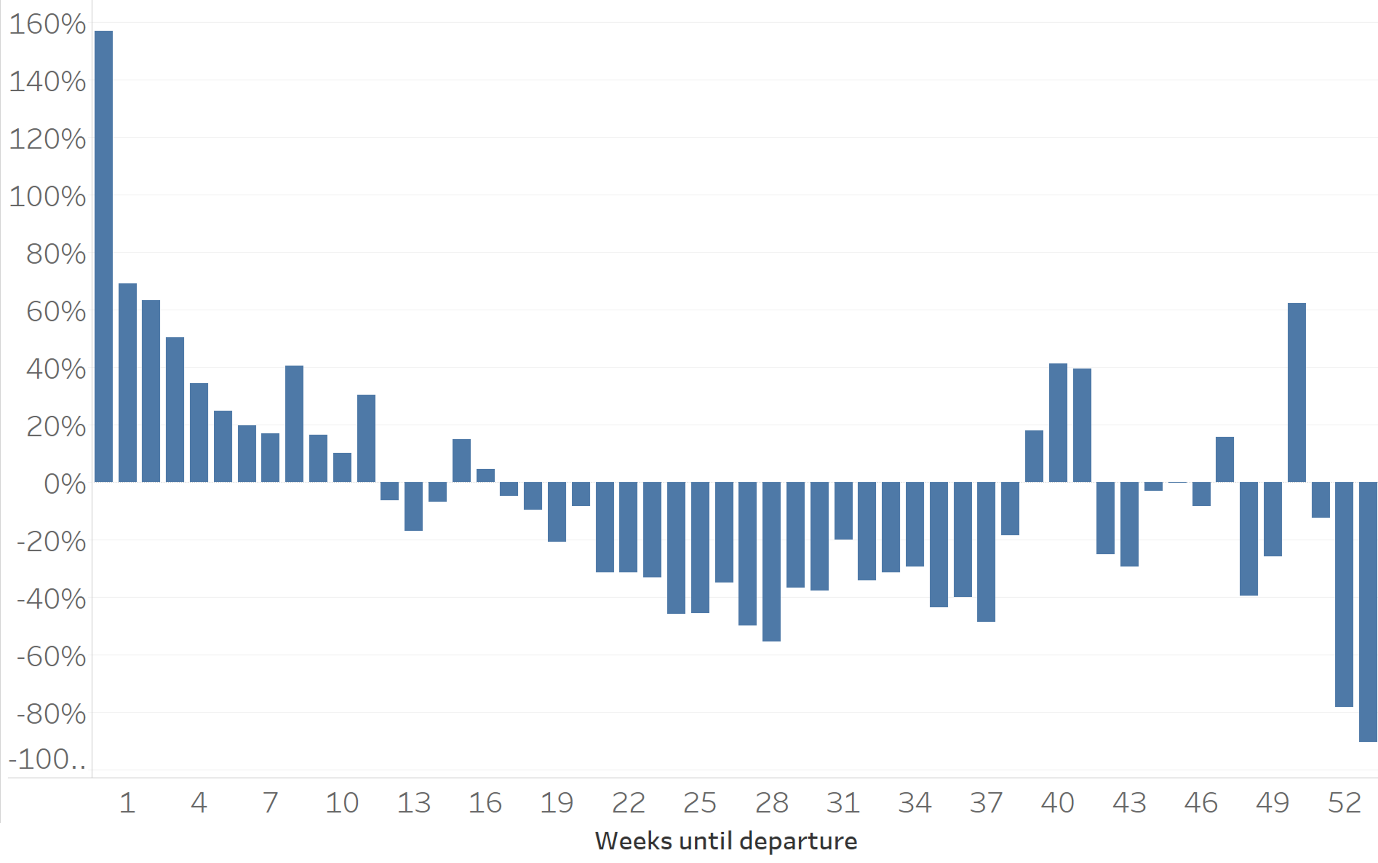
In this graph we can see two distinct zones (the period to the right after week 40) is quite low volume so the trends can be safely ignored.
This is showing quite clearly a shift to shorter lead time bookings, probably driven by consumer confidence in what’s going to happen in the longer term.
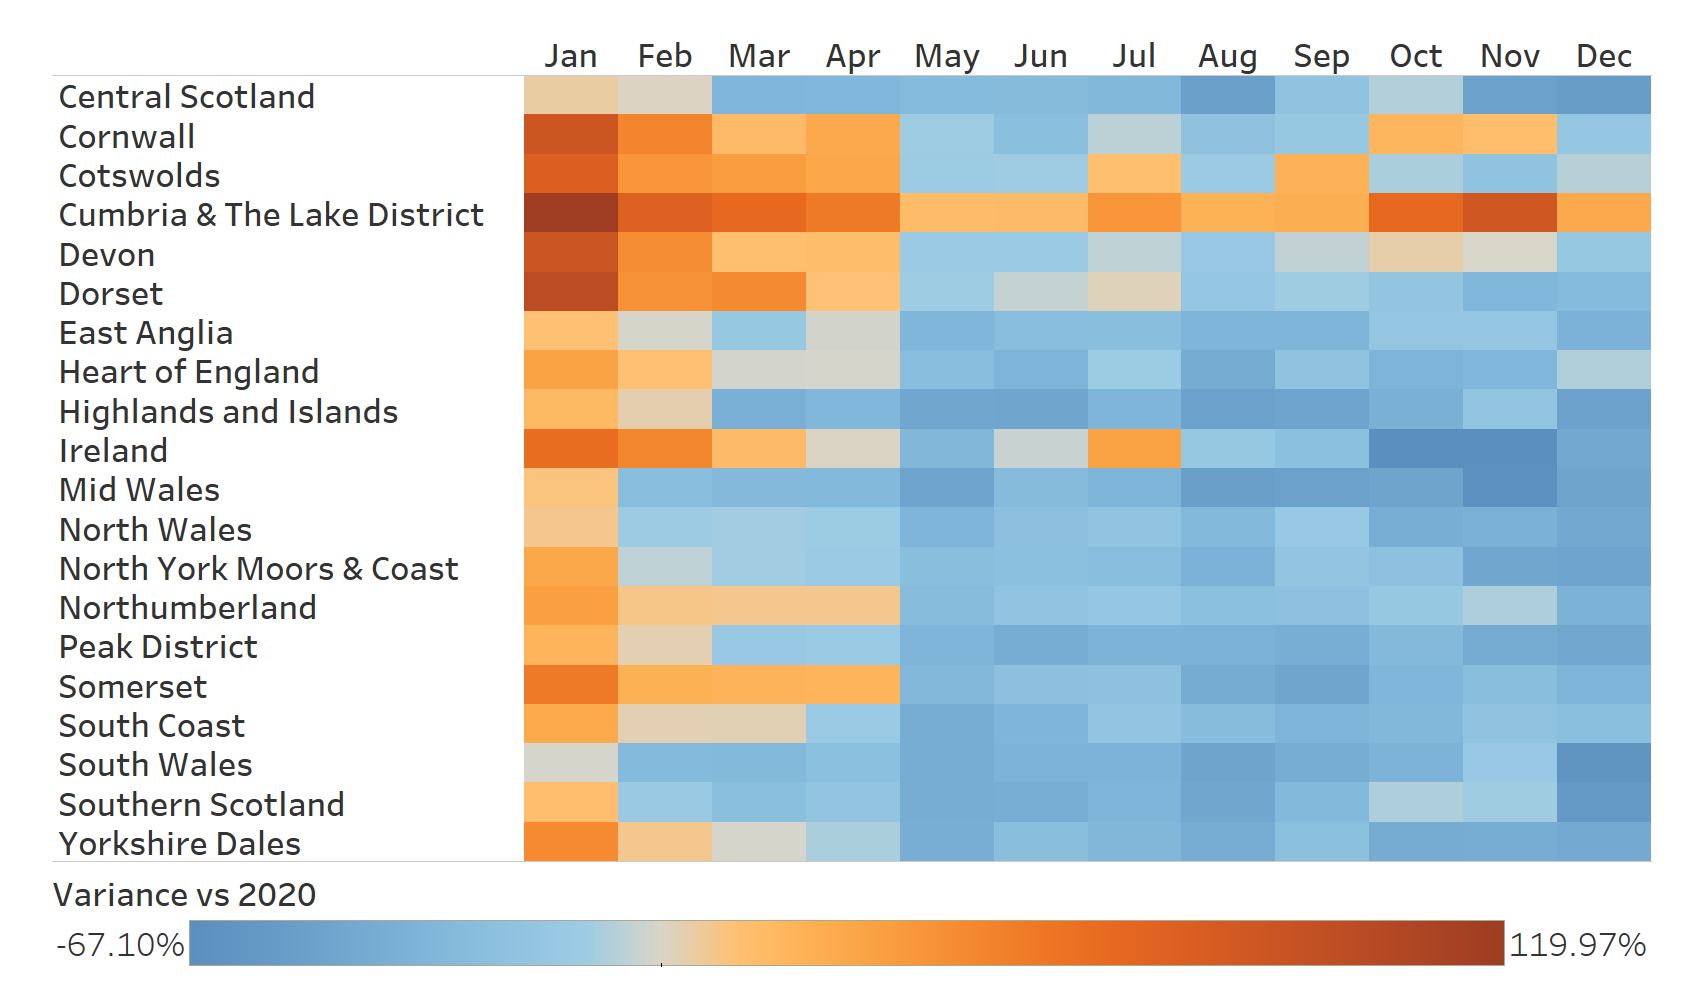
Variance by Region
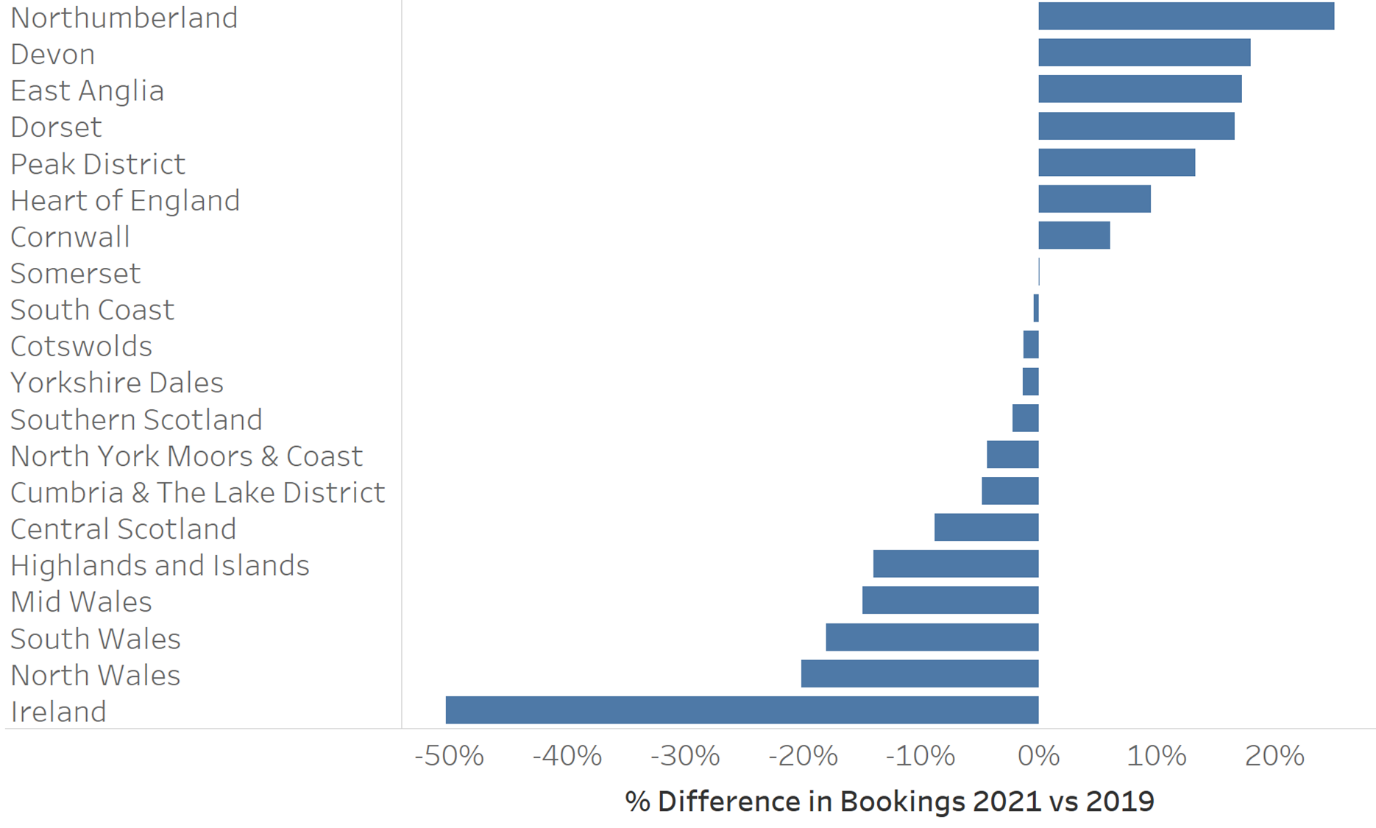
The regional view is interesting there are some clear shifts present here too. We probably need to ask why a few more questions to understand what’s going on here. Some of it will be explainable by shifts in regional stock volumes.
Other possible causes could be people less willing to travel further or it could just be related again to the season they’re booking in, i.e. people travel further generally for their summer break that the winter.
These shifts to shorter lead time bookings could be seen as positive by the industry. If these shifts are driving incremental bookings i.e., bookings we might not otherwise received, then we can reasonably still expect the longer lead time bookings to come at some point.
Here at Sykes that is what we are seeing in terms of increased occupancy for Winter with the view that Summer will come later and be strong for demand.
As I have constantly said, we operate in a supply constraint market.
In next weeks blog post, we will dig a little more and attempt to answer the question on incrementality.
If you would like us to deep dive on any area or have questions, please post in the comments
About Sykes
The data and techniques shared in this article were produced by the development team at Sykes. If you are a talented Data Scientist, Analyst or Developer please check out our current vacancies.